Basic Candle Pattern
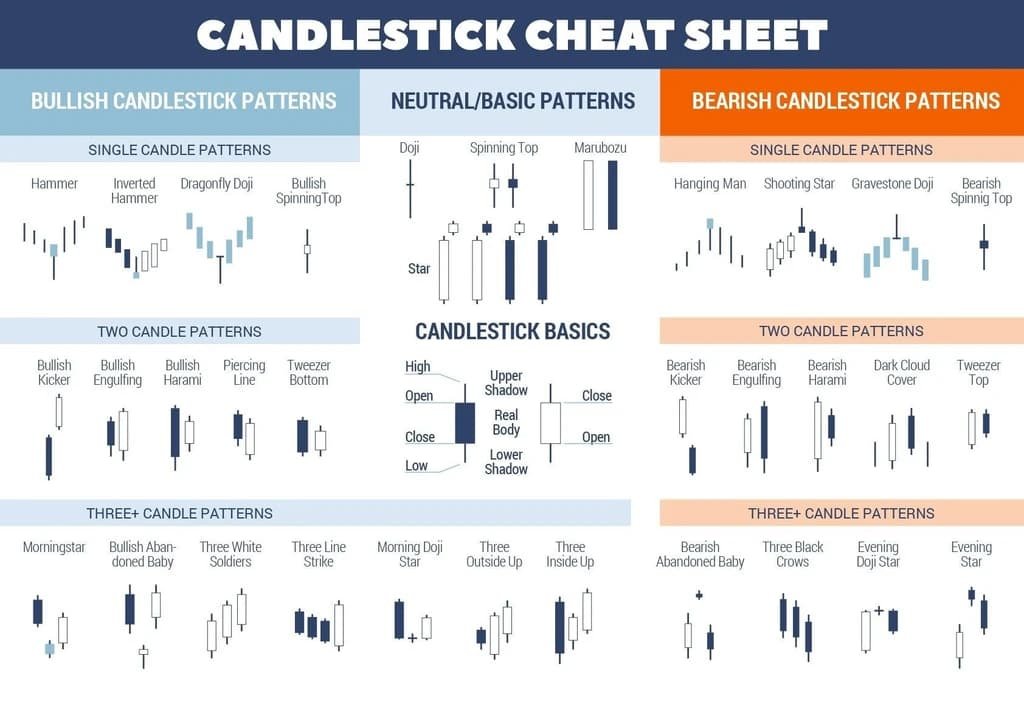
Candlestick charts are a technical tool that pack data for multiple time frames into single price bars. This makes them more useful than traditional open-high, low-close bars (OHLC) or simple lines that connect the dots of closing prices. Candlesticks build patterns that predict price direction once completed. Proper color coding adds depth to this colorful technical tool, which dates back to 18th century Japanese rice traders.
Study these pattern to learn when to start looking at the potential resistance or support levels indicated by a retracement Fibonacci scale.