Advanced Technical Analysis In Cryptocurrency Trading

Technical analysis is a careful analysis of coin reports and charts. Although with a few close similarities with other forms of trading, cryptocurrency’s unique characteristics have helped made several tools invaluable in studying coin behaviour, predicting future movement to take proper trading steps.
In this article, you would learn about more advanced methods employed in the technical analysis of cryptocurrencies, e.g. Bitcoin. Each of these methods has striking characteristics, and readers are advised to study them carefully.
JAPANESE CANDLESTICKS METHOD FOR TRADING CRYPTO
The Japanese candlesticks are technical analysis tools used to provide adequate trading data to investors. Since cryptocurrency trading occurs on exchanges, there is a section that shows charts in the form of graphs, having different time frames from 1 hour, one day, one week, one month etc. When observed carefully, when zoomed in, two types of candlesticks are seen that make up the chart. They are red and green candlesticks. The red candlestick is used to illustrate a decline in price while the green candlestick is used to show an increase in price.
Even though cryptocurrencies are entirely different from other traditional assets, similarities exist between them in the way they are charted coupled with the open, high, low & close (OHLC) of trading. The OHLC is identified in the image below.

Research shows that five favourite candlestick patterns provide useful direction for traders. These candlesticks work within price ranges in predicting the next movement of the trade either increase or decrease in value. The most accurate patterns are divided into two namely reversals and continuations. Reversals are patterns that predict a downtrend in price while continuations is a pattern that predicts an uptrend in price from its present price.
A trend can either be bullish or bearish. A pattern is said to be bullish when it is in the direction of an upward trend while it is said to be bearish when it is in the direction of a downward trend. The five popular candlesticks are namely The Hammer, The Piercing Line, The Bullish Engulfing Pattern, The Morning Star and the Three Soldiers.
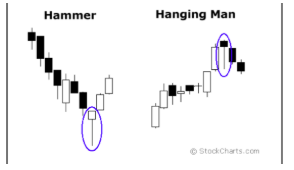
The Hammer shows a bullish pattern in a reverse order in which the asset nears a downtrend. Its opposite is Hanging Man.
THE ELLIOT WAVE PRINCIPLE METHOD FOR CRYPTOCURRENCY
This principle is a form of technical analysis that employs the study of market psychology, identifying the 24hr High and Low prices and use these factors in making market decisions. Every trader that use this form of technical analysis believes that the crypto market is influenced by market psychology using fundamental analysis. Success when using Elliot wave can


